
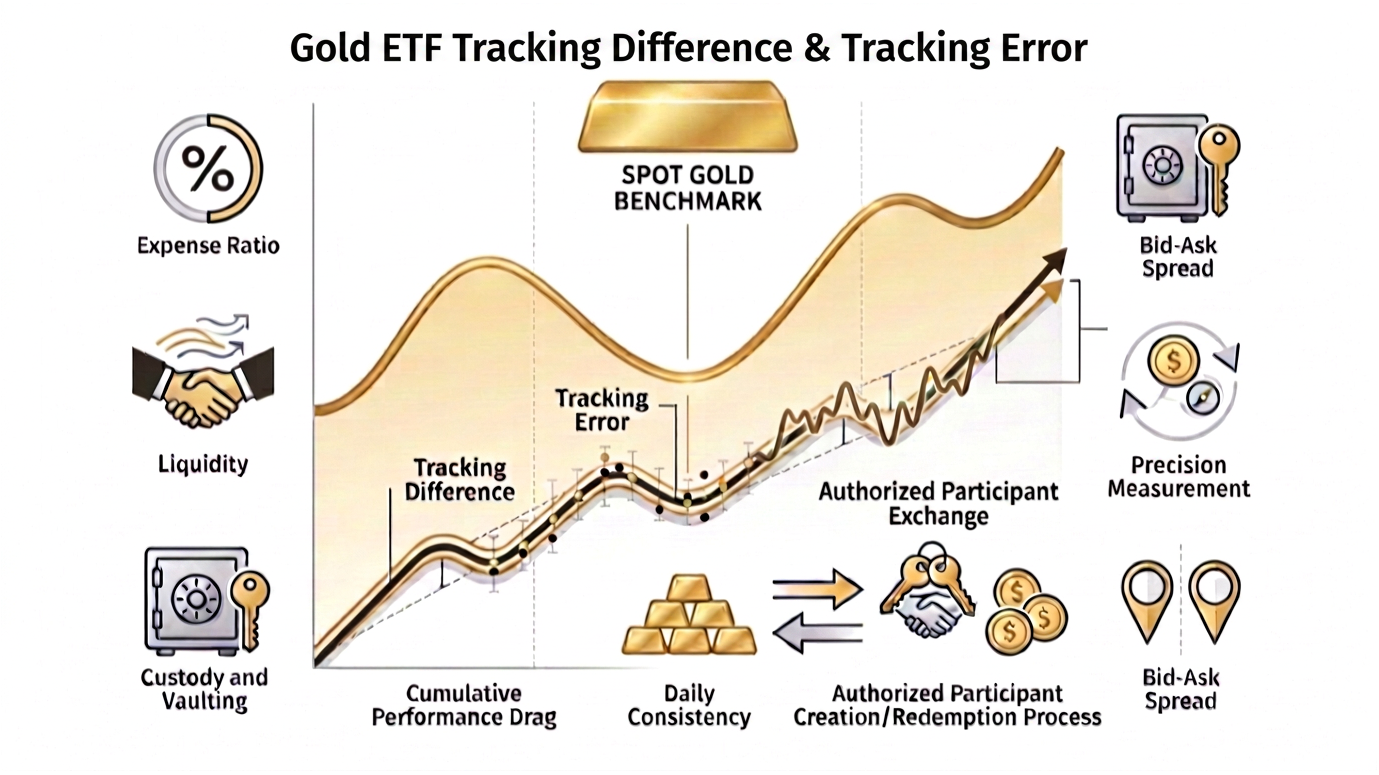
Key Takeaways
- Tracking error is a broad term that covers two distinct measurements: tracking return difference (the performance gap) and tracking return volatility (the consistency score).
- A fund can show a small, consistent tracking return difference and still carry a high tracking return volatility, which signals unpredictable replication.
- Expense ratios, cash drag, replication method, and liquidity are the primary drivers of both metrics.
- Judging either metric from a single time period can be misleading – rolling period analysis reveals far more about a fund’s actual behavior.
- Resources like the Gold ETF Tracking Error calculator at GoldETFCalculator.com help investors see how these differences compound over time and affect real returns.
Two investors can look at the same ETF, read the same fund factsheet, and walk away with completely different conclusions – because the term tracking error gets used to mean two different things. Understanding which measurement is being referenced, and why each one matters, is one of the most underappreciated edges in ETF due diligence.
Tracking Difference and Tracking Error: Two Distinct Metrics
The term tracking error gets used loosely across the ETF industry. James E. Ross, Chairman of the Global SPDR Business at State Street Global Advisors, addressed this directly: “The term ‘tracking error’ gets thrown around a lot in the industry, but it can refer to two different measurements, which creates confusion among investors during the due diligence process.”
Those two measurements are Tracking Return Difference and Tracking Return Volatility. They are related but measure entirely different things. One tells you how much the ETF diverged from its benchmark. The other tells you how consistently it diverged. Conflating the two is a common mistake that can lead to poor fund selection.
Tracking Return Difference: The Performance Gap
Tracking Return Difference is the more straightforward of the two. It is the numerical gap between an ETF’s net asset value (NAV) return and the return of the index it tracks, measured over a specific period. The formula is simple: Tracking Return Difference equals the ETF’s NAV return minus the benchmark return over the same period. The result is a positive or negative figure that shows exactly how much ground was gained or lost relative to the index.
Positive vs. Negative Readings
A negative tracking return difference means the ETF underperformed its benchmark – the most common outcome. A positive reading means the ETF outpaced the index it was designed to track, which sounds counterintuitive for a passive fund but can occur under specific conditions, such as when securities lending revenue or favorable dividend tax treatment adds to returns.
The lower the absolute value of this number, the closer the ETF is hugging its benchmark. The sign matters too – knowing whether the drift runs consistently in one direction helps contextualize the figure.
Why ETFs Usually Lag – But Not Always
The most predictable source of negative tracking return difference is the expense ratio. An index carries no fees, but an ETF does. Every basis point in annual cost creates a drag that shows up directly in this metric. For passive ETFs, the total expense ratio (TER) is widely considered the strongest predictor of future tracking return difference – higher fees produce a wider gap.
Some ETFs narrow or even reverse that gap through securities lending, where the fund temporarily loans its holdings to short sellers in exchange for a fee. The income generated can partially or fully offset operational costs, producing a tracking return difference smaller than the expense ratio alone would suggest – or occasionally a positive one.
Tracking Return Volatility: The Consistency Score
Tracking Return Volatility answers a different question entirely: not how far did the ETF drift, but how erratically did it drift? It is calculated as the annualized standard deviation of the daily return differences between the ETF’s NAV and the benchmark index.
How Annualized Standard Deviation Works Here
Each trading day produces a return difference – the ETF’s daily return minus the index’s daily return. Collected over time, these differences form a distribution. A tight distribution means the fund is replicating consistently day after day. A wide distribution means the fund’s daily performance relative to the index is unpredictable.
Annualizing the standard deviation allows comparisons across funds and time horizons on the same scale. A lower tracking return volatility number signals a well-managed, consistent replication process. A high number is a flag – even if the average tracking return difference looks acceptable, the path getting there may be rough and unreliable.
Why Both Metrics Tell a Different Story
A fund can carry a low tracking return difference alongside a high tracking return volatility – meaning its average performance is close to the index, but the path there was jagged and inconsistent. Conversely, a fund might show a moderately negative tracking return difference but maintain very low volatility around that drift, making it highly predictable even if not perfectly cost-efficient.
For passive index ETFs, tracking return difference tends to be the more actionable number – it directly reflects cost drag and operational efficiency. For active ETF strategies, tracking return volatility becomes more central to due diligence, as it reveals how much risk a manager is taking relative to the benchmark. Both matter, and neither replaces the other.
What Drives Tracking Error Higher
Several structural factors push both metrics wider. Understanding these drivers helps distinguish between tracking drift that is unavoidable and drift that signals a management problem.
Expense Ratios and Cash Drag
The expense ratio is the most direct lever. Administrative, compliance, management, and operational costs are deducted from the fund’s NAV daily, creating a continuous, compounding drag. Even a difference of 10 to 20 basis points in annual fees leads to meaningfully different outcomes over a decade, given the compounding effect on total return.
Cash drag is the second culprit. ETFs occasionally hold a small cash position – often a byproduct of dividend payments received before reinvestment. If the market rises 10% and a fund holds even 1% in cash, that 1% earns nothing, introducing a gap. In strong bull markets, even small cash positions can have an outsized effect on tracking return difference.
Replication Method and Liquidity
ETFs using full physical replication – holding every security in the index at exactly the same weight – generally produce lower tracking return volatility than those using optimized sampling, which holds a representative subset. Sampling introduces basis risk; the securities held may not move in perfect lockstep with the full index, particularly during volatile periods.
Liquidity compounds this effect. ETFs tracking high-yield bonds or emerging market debt face higher transaction costs when buying or selling positions, widening both the performance gap and the volatility around it. The less liquid the underlying market, the harder it is to track the index precisely.
Never Judge Tracking Error on One Period
Single-period snapshots of tracking metrics can be deeply misleading. State Street Global Advisors made changes to the portfolio management process of the SPDR Bloomberg Barclays High Yield Bond ETF (JNK) in early 2016. An investor looking only at a three-year window ending in mid-2019 would see a 50bps annualized lag versus the benchmark – but an investor who examined rolling periods post-implementation would see the improvement trajectory clearly: 45bps annualized from March 2016 onward.
Rolling period analysis reveals whether tracking error is improving, deteriorating, or stable. It separates a genuine structural shift in fund management from a temporary aberration caused by a one-off market event. Treating any single data point as the full story is one of the most common errors in ETF due diligence.
Lower Costs Mean Less Tracking Drift Over Time
The compounding math is unforgiving. A 0.4% annual tracking return difference looks negligible in year one. Stretched over ten years, the cumulative drag on total return becomes substantial – before even accounting for the opportunity cost of reinvested returns that were never earned. Morningstar researchers reviewing ETF tracking behavior across multiple case studies consistently emphasized this point: underlying drivers matter more than surface-level numbers, and cost is the most persistent driver of all.
Prioritizing low-cost index ETFs keeps the tracking return difference narrow and predictable over the full investment horizon. A fund with a slightly higher expense ratio may look competitive in the short term but compounds the disadvantage every single year it is held. Investors who understand both Tracking Return Difference and Tracking Return Volatility move beyond comparing expense ratios alone. Evaluating both metrics provides a more complete picture of ETF quality, replication efficiency, and the long-term cost of ownership.
For a closer look at how these metrics play out in a specific asset class, GoldETFCalculator.com offers tools and analysis built around understanding ETF cost efficiency and tracking performance over time.
Gold ETF Calculator
support@goldetfcalculator.com
502 W 7th St, Ste 100
Erie
PA
16502
United States


